Beyond Uptime: Assembling a Confidence Budget That Measures Earned Trust
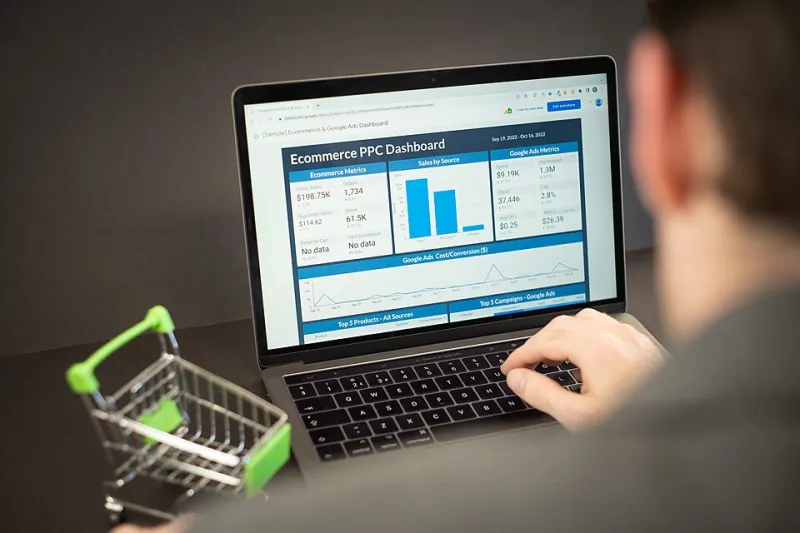
Photo: Zuko.io Images, CC BY 2.0, via Wikimedia Commons
Uptime is the number that gets reported upwards, and it is almost always good. A UK retail or membership platform can publish 99.98% availability, hold p95 response times inside its service level objective and register a 5xx rate that barely ripples — and still lose customers who quietly conclude that the site cannot be relied upon. The failure that erodes trust is rarely an outage. More often it is a postcode lookup that returns nothing, a consent banner that returns on every page, a padlock that Chrome decorates with a warning triangle, or a support queue that takes forty minutes to answer a question about whether an order actually went through.
Availability metrics describe the behaviour of infrastructure. They do not describe a customer's willingness to proceed. A confidence budget exists to close that gap, and to give product and engineering leaders a shared number that reflects the second question rather than only the first.
Availability is a floor, not a ceiling
UK digital functions have spent a decade tightening objectives around availability, latency and error budget consumption — a discipline borrowed from site reliability engineering and now routine in banks, grocers, insurers and public sector platforms alike. That work is valuable. But an error budget measures how much unreliability an engineering team can absorb before shipping pauses. It says nothing about how much unreliability the customer will absorb before abandoning the basket.
Picture a checkout that completes nine times in ten but fails without explanation on a Saturday evening for customers using a particular mobile wallet. Availability dashboards will show a healthy service. The contact centre will show a spike. Trust will decline in a way that no single team currently owns.
Four families of signal
A confidence budget aggregates evidence that most estates already hold, weighted to reflect commercial consequence.
Perceived competence — Core Web Vitals. Field LCP, INP and CLS at the 75th percentile remain the closest thing the industry has to a shared measure of whether a page feels professionally assembled. Segment by template and device class. A quick homepage offers little comfort if the product page is slow on a mid-tier Android handset over 4G.
Perceived safety — transport and header posture. HSTS, a deliberate Content Security Policy, frame ancestors, Referrer-Policy and a clean certificate chain do not make a site secure by themselves. Their absence, however, is a dependable proxy for immaturity, and browsers increasingly surface fragments of that immaturity to users.
Transaction integrity — task failure rate. Not HTTP errors, but business-level failure: declined authorisations caused by integration faults, address validation dropouts, abandonment on the final step, duplicate submissions, and the share of sessions that need a retry to reach a confirmed outcome.
Recovery signal — support contact rate. Contacts per thousand sessions, broken out by reason code. A rise in 'where is my order' enquiries a fortnight before peak is an early warning that confirmation emails or order status pages are underperforming, and it is measurable long before revenue reporting catches up.
Constructing the budget
A workable model normalises each signal to a zero-to-one-hundred sub-score against a rolling baseline, then applies weights reflecting the business model. A retailer will weight transaction integrity most heavily; a membership body may weigh performance and support equally. An illustrative weighting for a transactional UK retail site:
- Transaction integrity: 35
- Core Web Vitals, field, 75th percentile: 25
- Support contact signal: 20
- Security header posture: 20
Two rules keep the composite honest. First, cap each sub-score so that no single catastrophic result can be averaged away — a site failing on HSTS should not reach green through strong performance elsewhere. Second, publish the components beside the composite whenever the score is quoted. A number without its parts invites arguments about the number rather than the evidence beneath it.
What the score is for
The composite is a conversation device, not a league table. It earns its place through three uses.
Trend detection. A stable 78 that drifts to 71 across six weeks is a narrative about tag accumulation, an unreviewed deployment or a creeping support backlog — and it is visible before the quarterly business review.
Prioritisation. When three teams compete for the same roadmap capacity, the component breakdown shows which lever moves the outcome most cheaply. A two-day header rollout that closes twenty points of the safety gap is easier to defend than an assertion.
Change justification. Security and reliability work is frequently funded on risk language. A modelled effect on a published score translates that language into something a finance director can weigh against conversion.
Governance and cadence
A monthly rhythm with quarterly deep reviews suits most organisations. Keep the monthly session short and genuinely cross-functional: product, engineering, security, customer operations and, where relevant, compliance. Set guardrails rather than targets — for example, that transaction integrity may not fall below the trailing twelve-week median without an incident review, or that header posture must not regress between audits.
In the UK context several of these signals carry obligations as well as commercial meaning. Consent behaviour sits under PECR and ICO guidance. Payment flows sit within PCI DSS scope. For regulated firms, operational resilience expectations make recovery signals part of the evidence base rather than a customer experience nicety. Treat the budget accordingly: it is an operational instrument that happens to be useful in supervisory conversations, not a compliance artefact dressed as a dashboard.
Where confidence budgets go wrong
Three failure modes recur. The first is over-weighting performance because it is the easiest to instrument, producing a score that rewards fast pages attached to fragile checkouts. The second is ignoring segmentation, where the aggregate conceals the older device, the slower connection and the assisted digital user. The third is mistaking the score for research — it should prompt qualitative investigation, never replace it.
A modest beginning
No data platform is required to start. A spreadsheet with four columns, a monthly meeting and a named owner will expose more than another wall of green tiles. The confidence budget is less a technology than a habit: the habit of asking, alongside whether the site is up, whether it is believed.